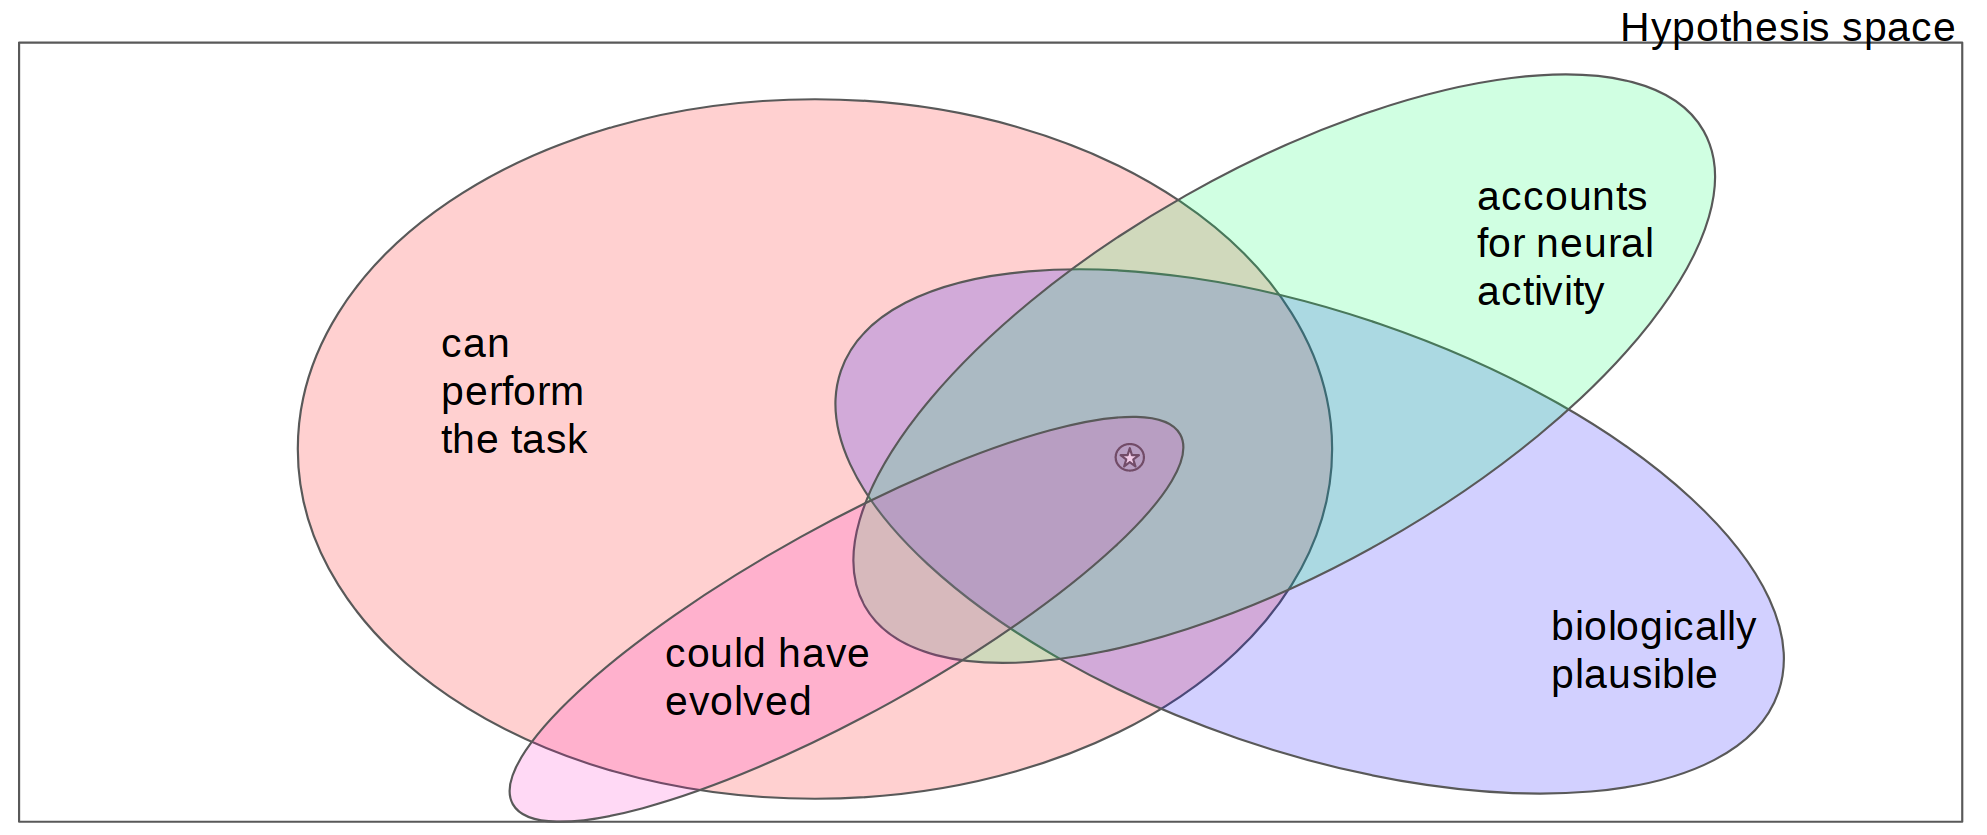
 Figure 1. Models lie at the intersection of one or more constraints. The rectangle indicates the space of all possible models where each point in the space represents a different model of some phenomenon. Regions within the coloured ovals correspond to models that satisfy specific specific model constraints (where satisfaction could be defined as passing some threshold of a continuous value). If a constraint is well-justified, this implies that the true model is contained within the set of models that satisfy that constraint. Models that meet more constraints, then, are more likely to live within a smaller region of the hypothesis space and hence will be closer to the truth, indicated by the star in this diagram.
 Figure 1. Models lie at the intersection of one or more constraints. The rectangle indicates the space of all possible models where each point in the space represents a different model of some phenomenon. Regions within the coloured ovals correspond to models that satisfy specific specific model constraints (where satisfaction could be defined as passing some threshold of a continuous value). If a constraint is well-justified, this implies that the true model is contained within the set of models that satisfy that constraint. Models that meet more constraints, then, are more likely to live within a smaller region of the hypothesis space and hence will be closer to the truth, indicated by the star in this diagram.